

Ethereum’s rainbow chart, featuring a logarithmic regression model crafted to track ETH’s extended growth pathway, has projected potential price ranges for September 30, 2025.
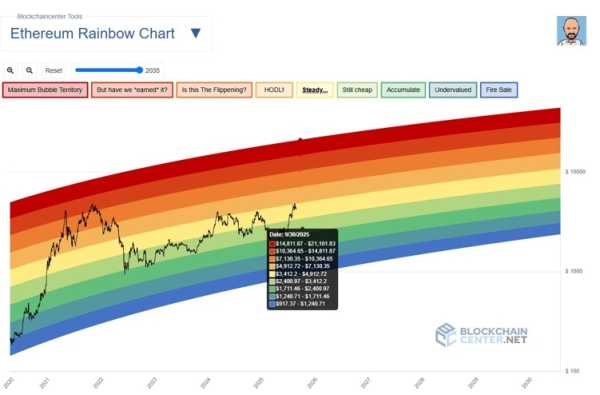
As per the visualization, ETH might trade at $1,947 if it enters the “sell-off” zone or surge to $21,101 should it reach the “peak bubble” territory.
Between these extremes, the bands indicate varying sentiment levels: $2,401 in the “Undervalued” range, $2,849 in “Accumulation,” $3,402 in “Still Affordable,” and $4,117 in “Steady.” Higher tiers show valuations of $4,912 in “HODL,” $5,913 in “Is This a Reversal?” and $7,304 in “But Did We Earn It?”
Currently, Ethereum hovers around $4,380, positioning it within the “Steady” band. This suggests that maintaining its current trajectory in the model could keep the cryptocurrency within the “Steady” or “HODL” brackets until late September 2025.
The rainbow chart serves as a short-term predictive tool, offering investors a long-term framework to evaluate Ethereum’s potential growth trends.
Источник: cryptocurrency.tech